Production performance incidents rarely begin with an obvious coding error.
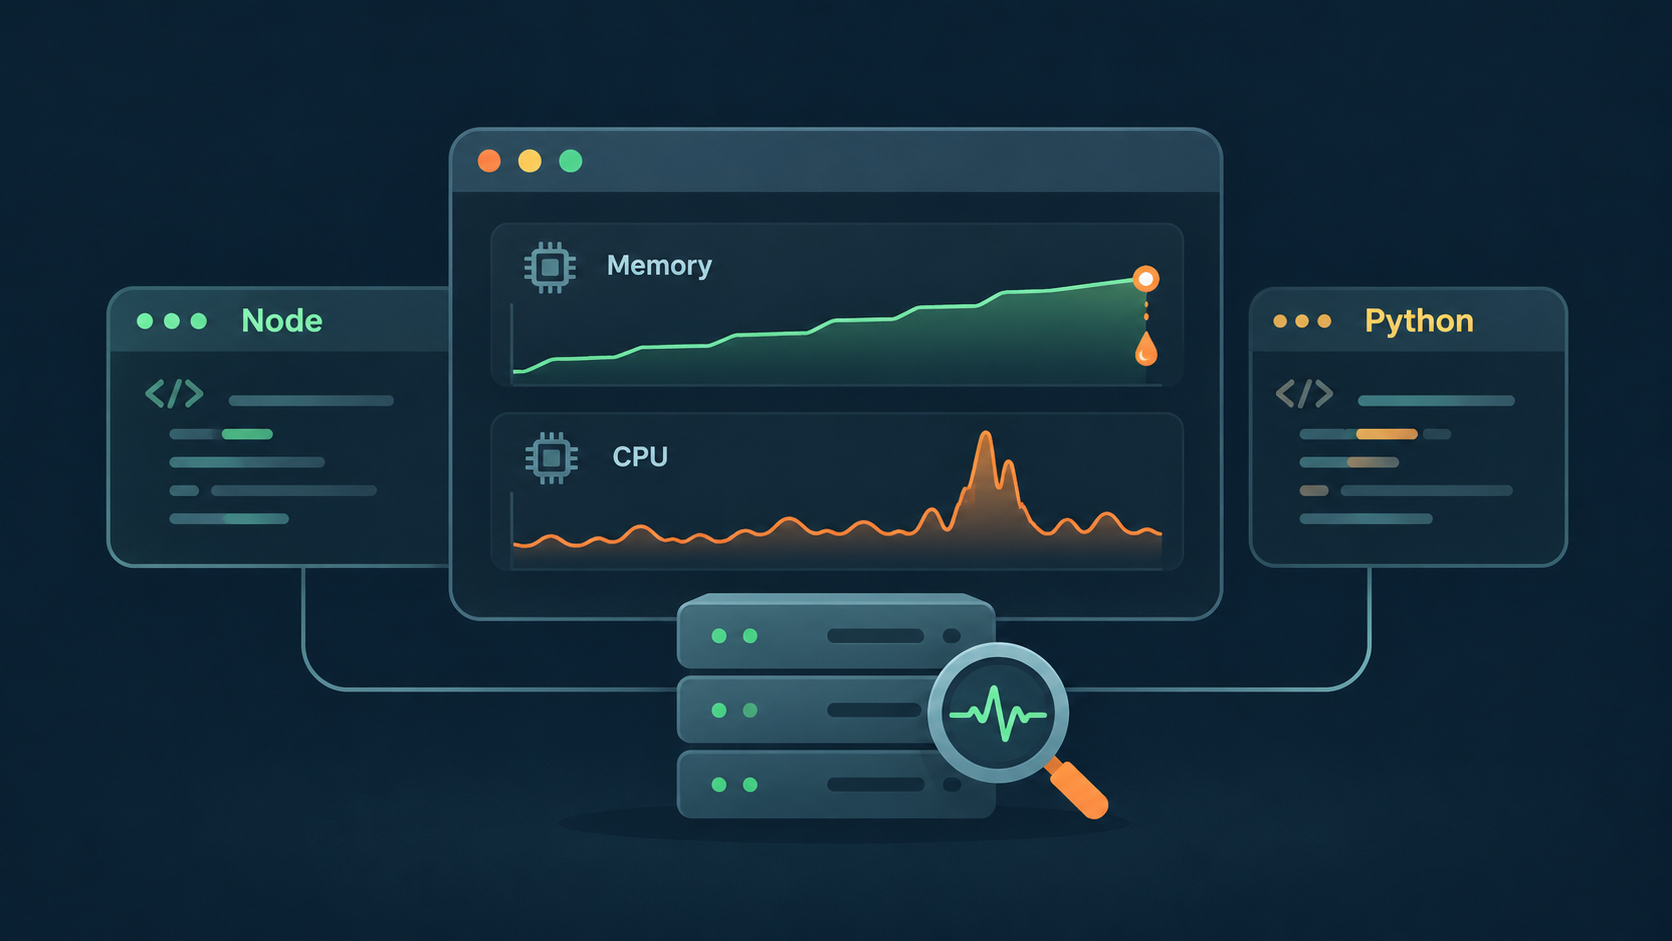
A Node.js service may gradually consume more memory over several hours. A Python API may show acceptable average CPU utilization while a small number of requests push latency beyond its service-level objective. Another application may perform normally during load testing but deteriorate when real traffic introduces larger payloads, long-lived connections, unusual query combinations, or third-party dependencies.
For engineering leaders, the difficult part is not seeing that something is wrong. Modern monitoring platforms already expose CPU, memory, latency, error rates, garbage collection activity, and infrastructure saturation.
The harder question is: which part of the application is responsible? That is where production profiling becomes useful.
Monitoring identifies symptoms. Profiling connects those symptoms to functions, allocations, objects, call stacks, and execution paths. For enterprises operating hundreds of services, that distinction can determine whether an engineering team fixes a bottleneck or simply adds more infrastructure around it.
Datadog’s State of Cloud Costs analysis found that 83 percent of container costs in its dataset were associated with idle resources. The finding is not evidence that every organization is overprovisioned, but it highlights an important engineering problem: adding compute capacity can hide inefficient application behavior without eliminating it.
How can teams tell whether increasing memory usage is actually a memory leak?
Not every upward memory graph represents a leak. Applications legitimately consume additional memory when traffic increases, caches warm, queues expand, or larger datasets enter memory. Garbage-collected runtimes such as Node.js and Python may also retain allocated memory rather than immediately returning it to the operating system.
The more useful signal is retained growth across comparable workload cycles.
Suppose a service handles roughly similar traffic every hour. Memory climbs from 1.2 GB to 1.8 GB, garbage collection runs, and usage falls to 1.3 GB. Later it rises to 2 GB and falls only to 1.5 GB. If the post-GC baseline continues increasing, engineers should investigate what remains reachable.
In Node.js, likely causes include arrays or Maps that continuously accumulate entries, application-level caches without eviction policies, event listeners that are never removed, closures retaining large object graphs, unresolved promises, Buffers, or request data referenced after the request has completed.
Python applications show similar patterns through growing dictionaries, global collections, caches, reference cycles, long-lived ORM objects, queues, or objects retained by application frameworks.
Teams should compare memory snapshots rather than relying on one snapshot alone. The question is not simply which objects are largest. It is which object types continue growing and why references to them remain alive.
Python’s tracemalloc supports snapshot comparison specifically for this purpose. It can track allocation locations, report memory by file or line, and compare snapshots to show changes in allocation size and count.
How should Node.js applications be profiled without creating another production incident?
Node.js performance investigations usually require separating CPU saturation, event-loop blocking, heap growth, and native memory consumption.
For CPU problems, V8’s profiler can capture call-stack samples and show where execution time accumulates. Node’s Inspector API exposes V8 CPU profiling directly, allowing engineers to start a profile around a known workload and export a .cpuprofile for inspection.
The resulting flame graph often makes unexpected behavior visible. A function that appears harmless in code review may execute millions of times. JSON serialization may dominate a request path. Regex processing, encryption, synchronous compression, transformation logic, or repeated object creation may occupy far more CPU than expected. Memory investigations require more caution.
Heap snapshots make retained objects and reference chains visible, but taking them indiscriminately on a heavily loaded process can be dangerous. Current Node.js documentation notes that generating a heap snapshot can require roughly twice the memory of the existing heap and synchronously block the event loop while the snapshot is generated. That creates a real risk of an out-of-memory termination on an already constrained process.
Production teams therefore need a controlled capture strategy. One practical workflow is:
Correlate monitoring data with a repeatable symptom, isolate an affected instance or replica, capture CPU profiles or memory evidence under representative traffic, compare profiles across healthy and degraded periods, identify the retaining path or hot execution stack, reproduce the behavior outside production, implement the change, and validate the result against the original latency, CPU, or memory baseline.
Node.js diagnostic reports can complement this process by capturing JavaScript and native stack information, heap statistics, resource usage, and platform details when failures or predefined signals occur. Node documents diagnostic reports as suitable for development, testing, and production problem determination.
The goal is not to run every profiler continuously. It is to collect enough evidence to move an investigation from “this pod uses too much memory” to “this execution path retains these objects after requests finish.”
How is profiling a Python production service different from profiling Node.js?
Python teams face a slightly different diagnostic problem because CPU behavior may involve Python code, native extensions, worker processes, asynchronous execution, and the Global Interpreter Lock depending on the runtime and application architecture.
cProfile remains useful when engineers need deterministic function-level timing and call counts. It can answer questions such as which functions consume cumulative execution time or which call chains repeatedly trigger expensive work.
For production workloads, however, sampling profilers are often more practical because they inspect execution periodically instead of tracing every function call. Tools such as py-spy are commonly used for this reason, while Scalene can provide CPU and memory analysis across Python and native execution. Existing Python profiling guidance similarly distinguishes tools according to whether teams need function timing, line-level analysis, memory behavior, or lower-overhead production observation.
Memory analysis requires equal discipline.
tracemalloc can reveal Python-managed allocations and compare snapshots, but a growing resident set size does not automatically mean Python objects are responsible. NumPy, database drivers, machine-learning libraries, image processing packages, and other native extensions can allocate memory outside the Python heap.
That distinction matters when an enterprise team spends several days optimizing Python objects while the actual leak sits inside native code or an external library.
Profiling should therefore correlate application-level allocation data with process-level metrics. If RSS continues growing while traced Python allocations remain stable, engineers should investigate native allocations, worker behavior, memory fragmentation, subprocesses, and extension libraries instead of assuming ordinary Python object retention.
When should profiling become part of production engineering rather than incident response?
The most mature teams do not reserve profiling for severe outages.
They establish performance baselines for critical workloads, retain representative profiles from major releases, and connect profiling investigations to SLO regressions, infrastructure changes, and capacity planning. That changes the operational conversation.
Instead of saying CPU increased after a release, engineers can determine whether a newly introduced function consumes more execution time. Instead of increasing pod memory limits after repeated restarts, they can identify whether retained objects are accumulating between garbage collection cycles. Instead of guessing that the database is slow, they can determine whether application-side serialization or transformation consumes most request time.
External support can become useful when the problem crosses several boundaries, particularly runtime internals, application architecture, Kubernetes resource behavior, observability, and cloud cost optimization. Large enterprise providers such as IBM and Accenture work across application performance and observability environments, while engineering consultancies such as GeekyAnts can fit situations where teams need deeper application-level investigation across Node.js, Python, APIs, cloud infrastructure, and product engineering. IBM, for example, positions its application performance tooling around correlating application SLOs with underlying infrastructure resources.
The selection should depend less on company size and more on the diagnostic problem. A monitoring platform may already show exactly where the service is degrading. What an engineering organization may still lack is someone who can trace that behavior through the runtime, codebase, infrastructure, and workload until the causal chain becomes clear.
For VPs of Engineering and platform leaders, that is the real value of profiling. It replaces capacity guesses with evidence.
When memory growth, CPU saturation, event-loop delays, or unexplained latency have survived routine monitoring and scaling changes, the next useful step is often a focused performance review of one representative production workload. A short profiling session can determine whether the constraint is architectural, runtime-specific, infrastructure-related, or simply a small hot path carrying far more traffic than anyone expected.