Enterprise web applications rarely become slow because of one badly written function or one undersized server. Performance usually deteriorates gradually as applications accumulate services, database calls, third-party integrations, client-side JavaScript, authentication checks, analytics, regional dependencies, and years of architectural decisions.
That creates a difficult problem for engineering leaders. Adding infrastructure can increase capacity without making an application meaningfully faster. Moving to microservices can improve independent scaling while introducing additional network hops. Adding caches can remove database pressure while creating invalidation and consistency problems.
Performance engineering therefore has to move beyond “make the website faster.” It requires an explicit model for how much latency every part of a transaction may consume and how the system behaves when traffic grows by 5x, 20x, or 100x.
Recent research into web application performance optimization also reinforces that performance must be addressed across multiple layers, including networking, computation, data access, caching, client execution, and delivery architecture rather than through a single optimization technique.
For enterprise teams, the practical objective is straightforward: keep important user journeys predictable at high percentiles even while workload, geography, data volume, and system complexity increase.
What does millisecond-level performance actually require?
Averages create false confidence.
An API with an average response time of 80 milliseconds may appear healthy while its p99 latency exceeds two seconds. For a large platform serving millions of requests, that tail represents a meaningful number of customers experiencing delays.
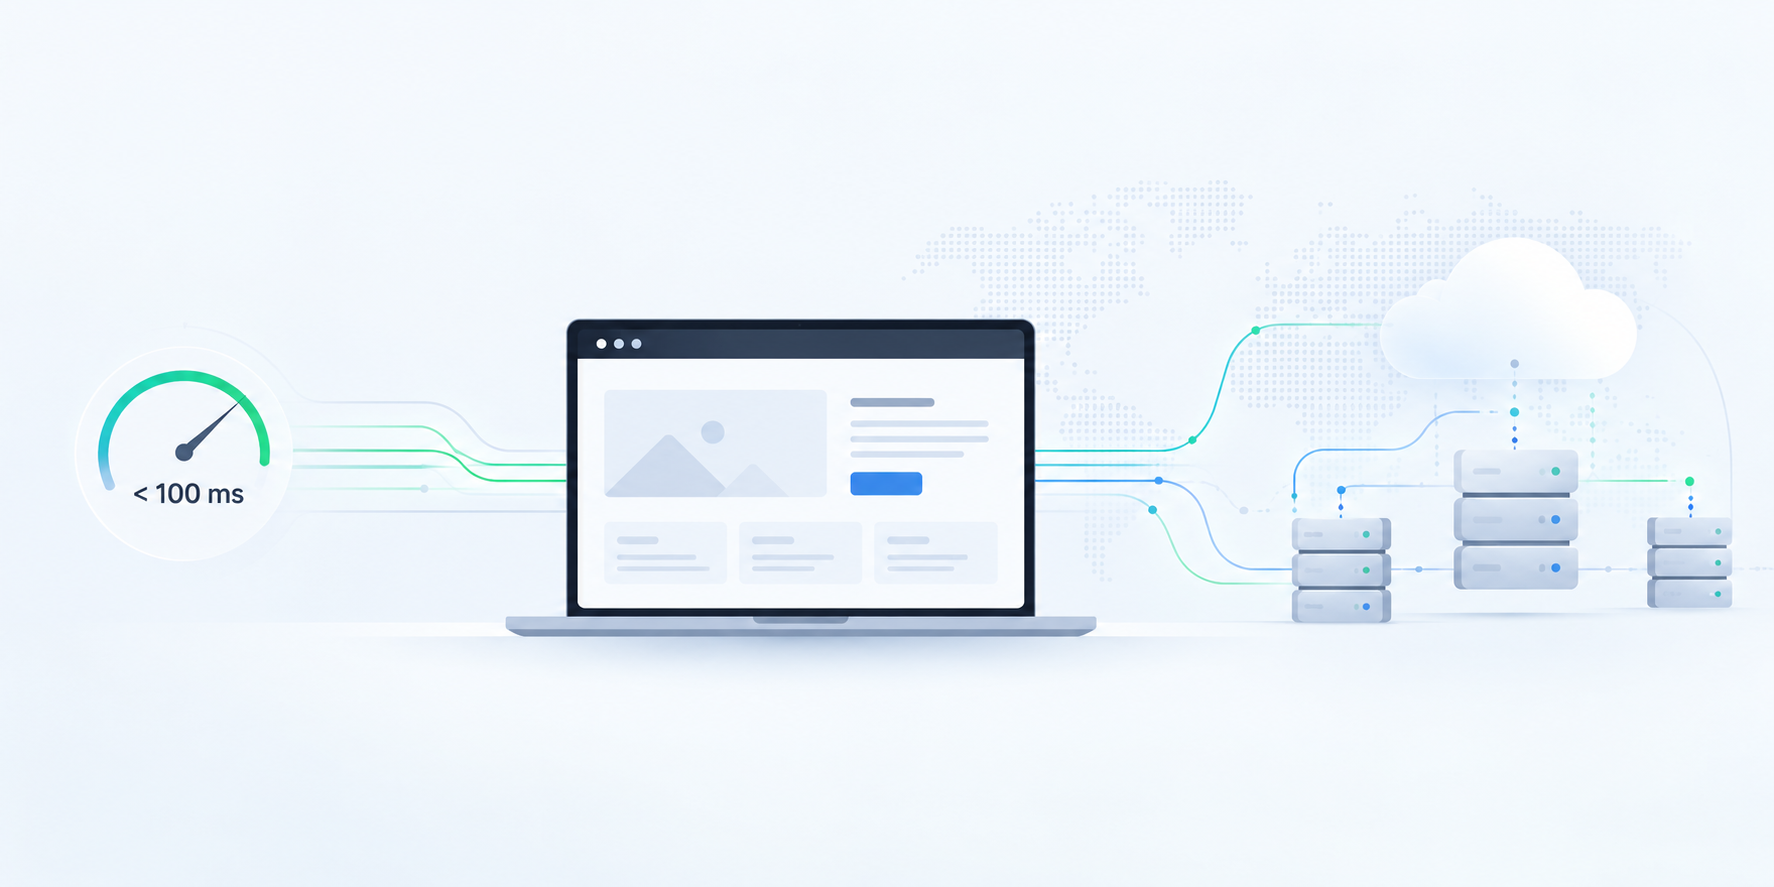
Performance teams therefore need to define service level objectives around percentiles and user journeys. A checkout operation might receive a 300 ms server-side budget while an autocomplete API may require less than 100 ms. An internal analytics query could tolerate several seconds.
The budget then needs to be decomposed.
A 200 ms backend target cannot support five sequential services consuming 60 ms each. The architecture must parallelize independent calls, remove unnecessary dependencies, introduce caches, precompute expensive results, or change the workflow.
The browser requires the same discipline. Google considers Interaction to Next Paint of 200 milliseconds or less at the 75th percentile a good responsiveness experience. INP includes input delay, event-handler processing, and the time required before the browser can present the next frame.
That distinction matters because backend optimization cannot repair an application whose main thread spends hundreds of milliseconds executing JavaScript.
A useful latency model therefore follows the complete request path:
user input → browser execution → network → edge → application → downstream services → data layer → response → rendering
Every boundary consumes part of the budget.
What architecture supports predictable latency as traffic increases?
The architecture should minimize the amount of synchronous work required to complete a user-visible operation.
A practical enterprise performance blueprint usually contains five layers:
- Push execution toward the edge where it removes distance from the critical path. Static resources, cacheable API responses, authentication metadata, personalization fragments, routing decisions, and selected compute operations can often move closer to users. The objective is not “edge everything.” It is to prevent requests from crossing a continent and traversing the complete application stack when the result can safely be produced earlier. Network distance remains a physical constraint. Cloudflare, for example, highlights round trips and round-trip time as fundamental contributors to web latency, which is why geographically distributed delivery can materially reduce response time.
- Keep synchronous request paths shallow. A frontend request that triggers an API gateway, which calls an orchestration service, which calls four microservices, each querying another service, creates latency multiplication. Independent operations should execute concurrently. Work that does not determine the immediate response, such as notifications, analytics enrichment, document generation, or secondary synchronization, should move through queues or event streams.
- Design caching as architecture rather than infrastructure decoration. Browser caches, CDNs, API caches, distributed key-value stores, application caches, and database caches solve different problems. Teams need explicit cache keys, TTL policies, invalidation strategies, ownership rules, and acceptable staleness windows. High cache-hit ratios can remove large volumes of repeated computation, but uncontrolled caching can return incorrect business data.
- Separate read and write scaling strategies. Read-heavy workloads can often use replicas, materialized views, precomputed aggregates, search indexes, or cached representations. Write-heavy systems require decisions around partitioning, contention, consistency, batching, and idempotency. Treating both workloads identically usually causes the database to become the scaling ceiling.
- Make horizontal scaling dependent on stateless execution and controlled state. Adding application instances works efficiently when requests can reach any healthy node. Session state, uploaded files, locks, background jobs, and local caches should not silently bind workloads to individual servers. Stateful components require their own partitioning and replication strategy rather than relying on application autoscaling.
AWS similarly frames performance efficiency around architecture selection, compute, data management, networking and content delivery, and an engineering process that continuously measures whether architectural choices remain appropriate as workloads change.
Why does the database usually become the hardest scaling problem?
Compute is comparatively easy to replicate. Data is harder because applications expect it to remain correct.
As load grows, database performance problems often originate from query patterns rather than raw storage capacity. Missing indexes, wide scans, N+1 queries, excessive joins, synchronous aggregation, connection saturation, lock contention, and hot partitions can turn a database into the application’s serialization point.
Engineering teams should examine query latency alongside rows scanned, lock duration, connection usage, cache-hit ratios, replication lag, IOPS, and the distribution of requests across partitions.
Partitioning also requires understanding access patterns before selecting keys. A technically balanced shard key can still perform poorly if important workflows continuously require cross-shard joins or distributed transactions.
The same principle applies to microservices. Splitting a monolith into twenty services does not automatically create twenty independently scalable systems. If every request still depends synchronously on a central customer database, identity service, or shared integration layer, the architecture retains a central bottleneck while adding network overhead.
This is why performance engineering should follow observed constraints instead of architectural fashion. Current guidance on scalable web applications similarly emphasizes identifying whether pressure comes from the frontend, database, backend, or long-running workflows before applying infrastructure changes.
Sometimes the fastest architecture is a modular monolith with strong caching and a well-designed database. In other situations, workload isolation and independent scaling justify service decomposition.
The correct architecture is the one that meets latency, throughput, availability, recovery, and cost objectives with manageable operational complexity.
How can an application scale without turning every traffic spike into an incident?
“Infinite scalability” is useful as an architectural direction, but no production system has infinite resources.
The practical target is elastic scalability without proportional degradation.
That requires engineers to know what happens before saturation. Autoscaling based only on CPU utilization often reacts too late. Queue depth, request concurrency, event-loop lag, connection-pool saturation, memory pressure, database utilization, and service-specific throughput may provide stronger signals.
The system also needs backpressure.
When downstream capacity falls, unlimited retries can transform a small failure into a platform-wide incident. Timeouts, bounded queues, retry budgets, exponential backoff, circuit breakers, concurrency limits, rate limiting, and graceful degradation contain failures before they propagate.
Load testing should therefore reproduce more than a headline request-per-second target. Teams should test sudden bursts, sustained peaks, hot records, cache misses, database failovers, degraded dependencies, regional latency, and partial service failures.
The key question is not simply, “Can the application handle 100,000 requests?”
It is, “What happens to p95 and p99 latency when one dependency becomes slow while the platform is processing 100,000 requests?”
That is where performance testing becomes resilience engineering.
How should engineering leaders measure performance in production?
The most valuable performance program connects user experience with distributed traces and infrastructure telemetry.
Real User Monitoring shows what customers actually experience across devices, browsers, regions, and network conditions. Application Performance Monitoring exposes service execution. Distributed tracing connects one transaction across gateways, APIs, services, queues, and databases. Continuous profiling reveals where CPU time and memory allocations disappear inside application code.
Teams can then correlate a poor customer interaction with the exact backend span, SQL query, dependency call, or browser task responsible.
Performance should also become a release criterion. Important user journeys can carry latency SLOs, frontend performance budgets, regression thresholds, and automated load tests in delivery pipelines.
That turns performance from an emergency optimization project into an engineering constraint.
Organizations that need to redesign this layer sometimes use external product and platform engineering teams to accelerate architecture assessments or modernization programs. Firms such as Thoughtworks, Accenture, and GeekyAnts operate in this space, although the appropriate partner depends on the existing stack, transformation scope, regulatory constraints, and internal engineering capacity.
The first engagement should rarely begin with a rewrite recommendation. It should begin with production evidence.
What should an enterprise performance review examine first?
A useful performance review maps a small number of revenue-critical or operationally critical journeys from the browser to the database and establishes where latency, capacity, and failure risk accumulate.
That means examining request waterfalls, frontend execution, geographic routing, API dependencies, cache behavior, query plans, concurrency limits, autoscaling signals, queueing behavior, and high-percentile production traces together rather than auditing each layer independently.
The result should be an architecture-specific performance roadmap, not a generic list of cloud optimizations.
For engineering leaders already dealing with rising latency, unpredictable peak behavior, database constraints, or expensive overprovisioning, a focused architecture and performance assessment can help identify which changes will materially alter system behavior and which will simply move the bottleneck elsewhere.
Explore a web application performance engineering consultation to map critical transaction paths, latency budgets, scaling constraints, and the architecture changes required before the next growth threshold becomes a production problem.